Question set 1 - minimum settings
Create the setup file
Try creating your own experiment setup file using the details described below
experiment 1
The experiment was conducted in experimental hutch 1 using a horizontal setup, and the data is being saved to the following path '/dls/science/groups/das/ExampleData/i07/fast_rsm_example_data/si40084-1/'. After aligning the sample the beam centre was (1455,270 and the detector distance was 0.45 meters. You would like the mapper to calculate both Qmap and Intensity vs Q profiles, and save the output to the data directory in the subfolder 'processed_data' . Additionally you would like to map each image individually.
experiment 2
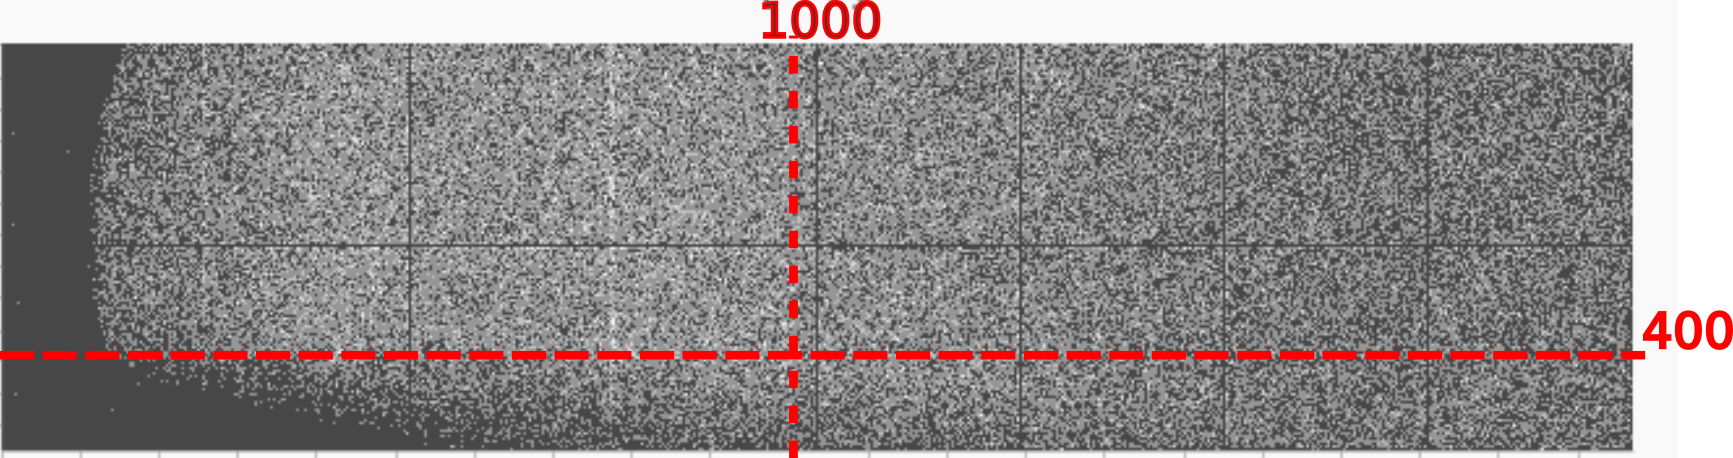
The experiment was conducted in experimental hutch 2, with data saved to the following path '/dls/science/groups/das/ExampleData/i07/fast_rsm_example_data/si41357-1' within the subfolder 'sample_A'. The beam centre is show in the image below with the two red lines, and the detector distance was 89 cm. You would like for all images to be combined into one map of the horizontal vs vertical exit angle, with a size of 800x800 pixels saved into a 'sample_A' subfolder in '/home/myoutputs/'. The detector positioning system was not used.